Retrospective analysis of prevalent anatomy spotter’s examination: an educational audit
Article information

Abstract
Purpose
The spotter’s (objectively structured practical examination) is an assessment tool which is widely used to test the practical knowledge of anatomy extensively. In Indian context it is used as an inclusive model in the gross anatomy practical examination and the marks allotted to it varies. The traditional spotter examination often has been blamed for only incorporating the initial levels of revised Bloom’s taxonomy. This study retrospectively analysed the pre-professional spotter’s examination score and tested its efficacy in terms of reliability, internal consistency, validity, educational impact, and resource intensiveness.
Methods
The summative data of student’s score on four different days of unrepeated spotter’s examination and final theory examination score was collected and tabulated. These four group of students acted as independent cohorts. The difficulty index (DI), point biserial correlation (PBC), Cronbach α (CA) and descriptive statistics of each cohort were calculated. Revised bloom taxonomy rating was applied to spotter’s.
Results
We found heterogenous distribution of spotter’s in each cohort according to DI. The PBCs and CA of each cohort were acceptable. The majority of spotter’s tested the cognitive and comprehension domain of revised bloom’s taxonomy. There was nonsignificant difference between mean scores of cohorts but we found low positive significant correlation between theory and spotter’s score.
Conclusion
We concluded that the construct of spotter’s was reliable, internally consistent, had fair validity, variable educational impact, and sustainable resource intensiveness. We propose urgent redesigning of spotter’s to include higher level of taxonomy to comply with emerging curricular changes.
Introduction
India is reforming its medical curricula due to demand to integrate anatomical education horizontally with other basic sciences and vertically to clinical subjects. In addition, innovative teaching and assessment techniques are being introduced into medical education [1]. In India, the undergraduate anatomy instruction in the bachelor of medicine and surgery course has only barely met the standards of western medical graduate institutions.
Due to varied clinical anatomical knowledge among students in conventional anatomy teaching a necessary, detailed and strategic approach to learning has produced a high outcome [2]. As such, an anatomy assessment need to constructively aligned to material tested [3] so that each examination question is mapped to the learning outcome (called blueprinting will likely produces better results), especially in a core curriculum [4].
An established assessment widely used in the anatomy practical examination is spotter’s (objectively structured practical examination [OSPE]) which exploits the prosected specimens, dry bones, histology slides, embryology models, plastinated models, and medical images. Spotter’s tests the three-dimensional (3D) spatial orientation, normal and variable differential relationship of structures with similar looking structures, and other body parts which is important for interventional diagnostics, imaging, and surgical practice [4].
Traditional spotter’s is a ‘sand and castle’ approach where a pin or flag is used to identify the structure under consideration [5,6] and a second question, mostly related to identification is hinged to it. A variant of the spotter examination is the ‘steeplechase method’ [7] where students have to identify a structure and then state simply its action or function. Some authors are discontent with spotter’s examination as it only tests identification or retrieval of knowledge [5,8]. Current trends wish to apply the educational objective domains, taxonomy ratings, and integration in the spotter’s. This is in demand to competency needs to be achieved in a present spiral curriculum which, in the Indian set up is often debatable.
The contribution of spotter’s marks in the internal assessment and passing out examinations varies. In most of the indian medical institutions it is an inclusive part of the examination and not an exclusive model as in some western countries. A robust assessment needs to test the validity, reliability, and educational impact of the method [5,9].
In this study, we proposed retrospectively analysing the spotter’s within four independent cohorts of students in a pre-professional end semester examination of anatomy in a teaching hospital in Eastern India. The study compared the spotter’s (OSPE) with evolving standards and explored their efficacy in terms of reliability, validity, educational impact, and resource intensiveness. We also tried to find a correlation between the total theory and spotter’s score of students to identify the strength of alignment between a spiral curriculum and assessment outcome. The research question of our study was as follows: “Are the spotter’s reliable and valid according to prevailing standards and does it portray real information about student’s gross anatomy cognitive abilities?”
Methods
1. Methodology
The data was collected from 2017 pre-professional examination scores at a premier medical college in Eastern India after obtaining ethical clearance from the institutional ethics committee (reference no., T/IM-NF/Anatomy/18/20). The summative data included spotter’s score of all students from anatomy practical assessments (OSPEs in the dissecting room) that were divided into four different cohorts (as different questions are asked on different days to a batch of students acting as a cohort). The theory assessment of two papers comprised of gross anatomy, histology, embryology, and miscellaneous final score were also recorded. All participant students gave their written informed consent to use their examination scores for analysis. On compilation we noticed 22, 23, 17, and 22 students attended respectively per day which we designated as cohorts A, B, C, and D. The difficulty index (DI), point biserial correlation (PBC), Cronbach α (CA) and descriptive statistics of each cohort were calculated. The DI expresses the proportion or percentage of students who answered the item correctly. PBC reflects the degree of relationship between scores of an item (correct or incorrect) with total test scores. CA was calculated after applying analysis of variance (ANOVA) one factor without replication to a contingency table of each cohort. Spearman rank correlation coefficient was used to assess the strength of association between total theory and spotter’s marks obtained by students.
2. Objectively structured practical examination preparation
The test was conducted on a session each of 4 different days for 25 students. The spotter’s were set by experienced internal examination officers and covered most of the anatomy course except for embryology and histology. Resources include a series of 10 dissecting tables, soft tissue specimens, and dry bones. The questions were set in a pattern of steeple chase/sand and flag castle model. Pins with a flag, thread, or chalk was used to highlight a specific part of soft tissue or bone. A second question related to the marked impression or pin was asked. Questions consisted of standard ‘identify-function- action’ and its clinical module (Figs. 1, 2). A buzzer was used to limit the answering time to one minute for each spotter. No extra time was provided to any students. The students were not allowed to touch the pins but they could appreciate the thread and impressions. Students recorded their answers on a sheet of paper after registering their credentials. Every spotter carried two mark each. If question consisted of two separate items whether inter-reliant or not if, they answer individual item correctly one mark was allotted. If any item of a spot consisted of a sub-item then half mark was allotted to each sub-item (partial credit). Spotter’s were scored manually by junior officers according to model answers. The disputed answers if arose were moderated by senior officers. The answers sheets were shown to the students for feedback and any correction only after completion of pre-professional examination. The students had adequate previous exposure to spotter’s.
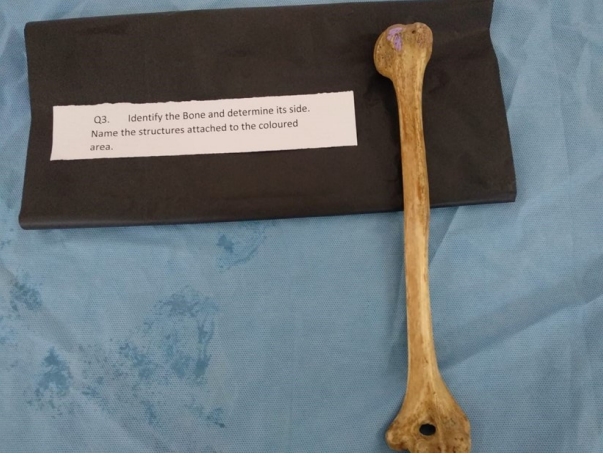
An Example of Spotter of Bone (Identify-Function-Action Model)
IRT: Item response theory.

An Example of Spotter of Soft Tissue (Identify-Function-Action Model)
The accumulated spotter’s marks were subjected to statistical analysis in Excel 2010 (Microsoft Corp., Redmond, USA) and GraphPad Instat ver. 3.06 (GraphPad Software Inc., San Diego, USA) to calculate descriptive statistics, DI, PBC, CA, and correlation coefficient of each spotter’s question. The threshold for statistical significance was kept at p<0.05. The DI was calculated pertaining to whether a total score of two marks was achieved in each spot by students. This gave the percentage of questions which are easy, moderate, and difficult to answer by students. PBC gave reliability of each question. The CA is a measure of internal consistency or reliability of the total examination and correlation coefficient between the scores for the theory examination and spotter’s test suggested the variance between score of different cohorts and their abilities. A rating was applied to each question, based on the revised Bloom’s taxonomy [10] where six levels are noted: (1) remembering knowledge, (2) understanding, (3) application, (4) analysis, (5) evaluation, and (6) creation. This also tested the setting of questions in terms of lower order or higher order of learning. The spot setters were unaware of this retrospective analysis.
Results
The DI and PBC of each spotter are shown in Table 1. Table 2 shows the distribution of spotter’s according to difficulty level in each batch. The DI of batch A ranged from 0.31 to 0.09 with spotter no. 9 registering a low of 0.09. Spotter 2 was qualified as easy, spotter 9 as difficult and all others as moderate. The DI of spotter’s of batch B ranged from 0.78 to 0.04 with spot 6 registering as low as 0.04. Spots 6, 7, and 8 got classified as difficult, spot 3 as easy, and all other moderate. The DI of spotter’s of batch C ranged from 0 to 0.52 with spots 2, 3, 4, 5, 7, and 10 registering below 0.25. Spot 2, 3, 4, 5, 7, and 10 were difficult whereas 1, 6, 8, and 9 were moderate. The DI of batch D ranged from 0.13 to 0.77 with spot 2 and 5 registering below 0.25. Spot 2 and 5 were difficult and all other spots were moderate. In batch D one spot was identified as easy, whereas batch C had no easy spotters. The PBC of batch A spotter’s ranged from 0.22 to 0.78 with spots 9 and 10 registering a low value of 0.22 and 0.25, respectively. The PBC of spotter’s of batch B ranged from 0.13 to 0.65 with spot 3 registering a low value of 0.13. Batch C spotter’s PBC ranged from -0.01 to 0.78 with spots 2, 6, and 9 with a low of -0.01, 0.28, and -0.04, respectively. In batch D spotter’s PBC ranged from 0.37 to 0.75 and no value below 0.3 was registered. All other spotter’s in each cohort achieved suitable DI and PBC. The spotter’s with unreliable PBC were excluded in calculation of final CA which was called CA with deletion. The CA coefficient before and after deletion in each cohort is shown in Table 3.
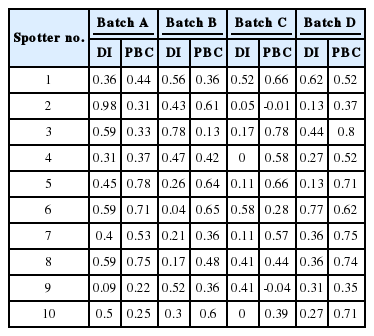
Difficulty Index and Point Biserial Correlation of Spotter’s in Each Batch (Cohorts)
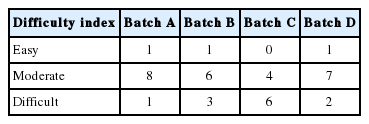
Distribution of Items (Spotter’s) according to Difficulty Level in Each Cohort
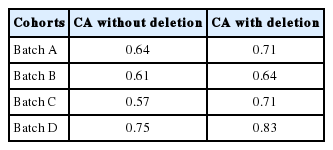
Cronbach α Coefficients with and without Deletion of Suspicious Spotter’s for Each Batch (Cohort)
The mean, median, standard deviation (SD), and interquartile range of all spotter marks of cohorts are displayed in the format of whisker and box plot in Fig. 3. The variance of score between batches is shown in Fig. 4. The mean and SD were 13.54±3.2, 12.93±3.07, 11.11±2.88, and 12.7±4.34, respectively for A, B, C, and D batch. We applied ANOVA single factor to compare the means. Parametric test yielded a non-significant p-value of 0.181 using method of Bartlett. The data of one batch showed non Gaussian distribution so the data was converted into log 10 and analysed with a non-parametric test, which gave same result. The spearman rank correlation between overall theory marks and the spotter’s marks was found to be 0.4482, which was statistically significant (Fig. 5).
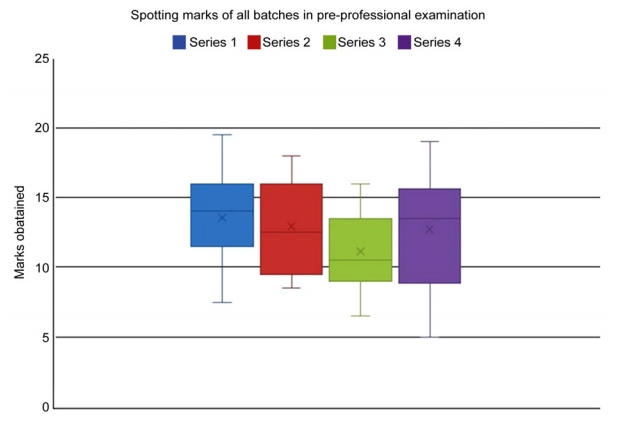
Box and Whisker Plot Graph of Each Batch Score
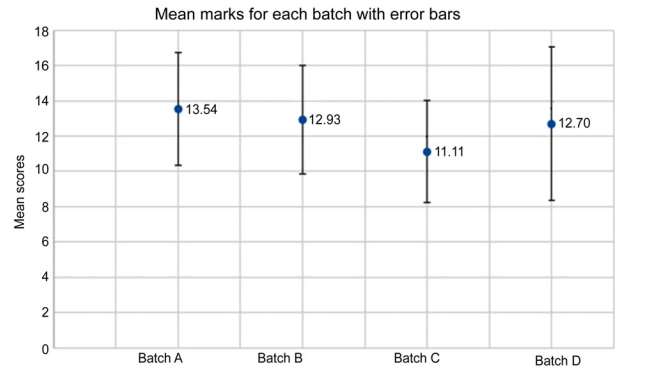
Graph Illustrating the Mean Score of Each Batch and Error Bars
Data are presented as 95% confidence interval.
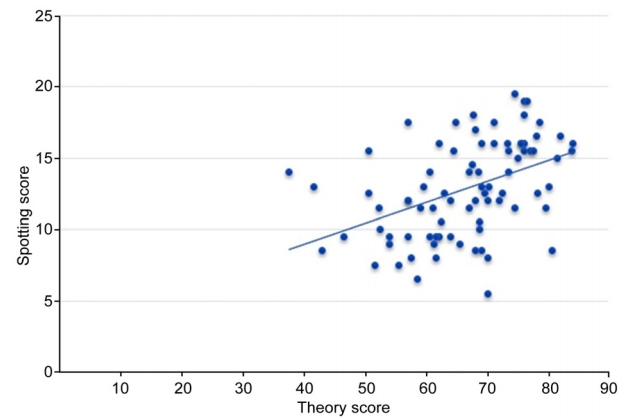
Correlation between Theory Score and Spotting Score
The Bloom’s taxonomy rating of all spotter’s is shown in Table 4. The nine questions in this format in batch A, B, and D equated to level one remembering (knowledge) and level two comprehension (90%) according to the revised Bloom’s taxonomy [10]. Only one spotter was asked about application in each cohort. These applications, though asked in text format, were not demonstrable as in the objectively structured clinical examination (OSCE). Batch C was comprised of only knowledge and comprehension. The spotter’s testing the clinical application had an acceptable DI and were discriminated well.
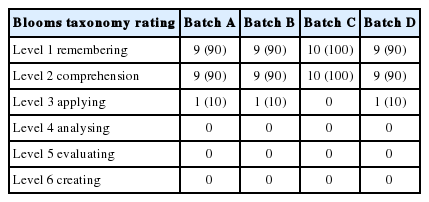
Blooms Taxonomy Rating for Anatomy Pre-professional Spotter Examination Questions
Discussion
The item analysis is built upon multiple choice questions (MCQ) but we have adapted it for the spotter’s (OSPE) examination. The idea behind using the item analysis in spotter’s is to objectively assess the items for suitability and to differentiate between students who do well in spotter’s and overall versus those who do not. By calculating the DI and PBC of each question we not only categorise them as easy, moderate, and difficult their but also get their discrimination ability between high and low scorers across exam. In comparison with MCQ’s, in spotter’s full or partial credit is given whereas in MCQ, it is all or none. In MCQ’s there is a chance for better scoring due to the cueing effect but this is not possible in spotter’s [9]. It has been shown that student will mold their study strategies according to content and format of the examination with which they are confronted [11]. This means valid assessment that ostensibly approximate performance in the real world will result in valid and meaningful learning behaviour [12]. This view is integrated in the concept of assessment for learning as opposed to assessment of learning [13]. Spotter’s being given to the students in semester exams may lead to more progressive responses and may introduce a contextual cueing effect if spots are repeated or flipped [14]. Although it does not influence the nature of thinking process elicited by the question [15].
With reference to Tables 1 and 2 distribution of spotter’s in each cohort is inequitable and heterogenous regarding DI. As the number of spotter’s is only 10, we cannot comment on percentage distribution but experts recommend the average level of difficulty for MCQ tests should be between 60% and 80% [16]. So, we expected a distribution of 2, 6, and 2 as easy, moderate, and difficult DI in spotters for the sake of equitable chance to each student in a cohort. Out of all cohorts, batch D had a matching distribution which is reflected in their PBC and CA values. The odd distribution of spotter’s in cohorts points to more importance to be given to thought process in construction of spotters by peers, their blueprinting, and creating an ideal spotters bank.
Peer review of all the spotter’s with a DI less than 0.25 and double checking of answers sheets excluded the possibility of mis-keying, ambiguity, and vague questions [16]. As spotter’s are free text responses chance of more than one correct answer was possible in the hinged part of a spotter but was handled with scrutiny. The most probable reason for low DI spotter’s appeared to be the too challenging aspect relative to the ability of different students.
PBC ranging from 0 to 1 is called positive discrimination whereas from 0 to -1 is negative discrimination. We expect a spotter with low DI value (difficult) to have a high PBC value meaning good performing students will likely get it more correct than low and vice versa but not below 0. A negative PBC value means that student who performed well on the test as a whole tended to miss the question under review and students who didn’t perform as well on the test as a whole got it right. It is a red flag and invites careful analysis of spotter’s. In batch C spots 2 and 9 were difficult but discriminated negatively. This invites analysis and, if possible, the spotter to be deleted. In batch C spot 4 registered DI of 0 but discriminated equally. All others spotter’s in all cohorts have fallen under acceptable range of DI and PBC, more than 0.3, as good items (spotter’s).
To explore the student achievements and variance of scores descriptive statistics with error bars were plotted. The lower mean value in batches C, D, and B reflects greater number of spotter’s set with DI below 0.25, showing disparity between cohorts in distribution of different degrees of DI. The non-significant relationship between the means suggests students have same range of ability and the variance of scores may be due to the method of setting of spotter’s, difficulty of the examination or to teaching, and the student’s preparedness. We applied the CA to test the internal consistency of the spotter’s. The CA without deletion in each cohort affirmed the expectation that students with higher level of knowledge have answered most items correctly and vice versa. In the context of two content domains examined, the moderate PBC values and improved values of CA after deletion makes these constructs internally consistent and reliable. We conclude that these constructs have examined the spotter’s length, content, and intercorrelations satisfactorily.
The low positive spearman rank correlation of 0.44 between theory and spotter’s examination may be justified in the non-reliable DI and PBC between some spotter’s and moderate range of CA in each cohort. These two assessments overlap in respect to cognitive knowledge, even though they have different constructs. This shows students who have scored good marks in theory also have scored better in spotter’s, proving the reliability of the construct of spotters. The reliability of spotter’s is reinforced by the fact that one minute was given to student to answer the spotters though it has been shown that time limit does not affect student’s response and spotter’s being free text responses generally leads to low reliabilities [17].
Taking into consideration the taxonomy rating of spotter’s it is clearly evident in Table 4 that negligible effort has been made to incorporate the clinical application. The examiners only focussed on essential building blocks limiting the rating to knowledge and comprehension, a lower order of cognition, and a superficial approach to learning [18].
It is stated that this part of learning is essential in enabling students to get key concepts or threshold concepts [19]. It is also argued that to comprehend, rather than just ‘know’ demonstrates more than a surface approach to learning anatomical material [20]. In this scenario the PBC of more than 0.3 in majority of spotters makes this construct a reliable one.
Some emphasised an appreciation of basic structures and functions, which can then be built upon, by introducing clinical applications and pathological conditions in the later years of their degree [21]. They also suggested it is not possible to use the application, evaluation, and synthesis domain of Bloom’s taxonomy in preclinical years and are suitable in later clinical years. It is stated that students must grasp the essential building blocks of anatomy in the early years of a vocational degree [5]. These observations follow the traditional spiral curriculum and the construct of these spotters are in alignment with it.
Concurrently, some recommend integrating basic sciences with clinical applications (the basis of OSCEs). They correctly argued an integrated approach would test clinically applied anatomy, and would reach the highest learning taxonomies [8]. It is reinforced that integration and application of knowledge helps students adopt a deep approach to learning [2]. Recently in a study Anatomy Competence Score was introduced. Their authors combined the scores of theories, 3D spotter’s practical knowledge, and OSCE’s to examine the overall performance of students [22]. Some have shown that comprehensive clinical knowledge is required for medical students to gain the appropriate clinical skills [23].
It has been demonstrated that as students are frequently driven by the assessment, higher taxonomy level can be judged with integration of preclinical and clinical subjects in a hybridised old spotter technique and OSCE’s and can be very powerful in promoting a deep approach to learning anatomy [5]. This approach would align with Medical Council of India’s reforms in undergraduate training [24].
We would take these constructs as fairly valid but should be in the process of continuous scrutiny when leaning towards integrated curriculum.
The choice of preparation for different measures of assessment are different by the students. The performance of students was acceptable. We think the educational impact of construction of spotters on item writers was variable as 10 spotters are built to test, automatically narrowing the selection of topics and restricting test.
As the spotter’s examination is a free text response, the construction of it required sufficient gross anatomy specimens and accessory material. The process of setting requires dedicated time, valuation, and moderation. As this pre-professional exam prepares student for the high-stakes exam a sufficient balance was maintained in this process. As the process is a yearly routine, we conclude that the resource intensiveness of this exam was acceptable and no extra cost was incurred.
In this study we have provided an insight into whether the methodology and distribution of spotter’s used in assessment in indian medical institutes are appropriate and equitable by analysing with suitable statistical tools whether spotter’s assessment align with curriculum.
1. Limitations
We have assumed the assessment methodology of spotter’s applied here is the same that used in other indian institutes. The spotters didn’t consist of histology and embryology spots. There may be errors in correlation coefficient between theory score and spotters score.
2. Conclusion
The present study examined the cognition and comprehension on four independent cohorts. The study revealed that there is disparity in setting of spotter’s in each cohort according to the DI but the construct of each cohort is reliable and internally consistent. The spotter’s construct and results are in alignment with spiral curriculum. The spotter’s fall short in accommodating the higher level of taxonomy domains to integrate with clinical subjects. We anticipate an immediate need of taxonomical reforms in spotter’s construct to comply with emerging curricular changes.
Acknowledgements
None.
Notes
Funding
None.
Conflicts of interest
No potential conflict of interest relevant to this article was reported.
Author contributions
Conception or design, data analysis, interpretation, and drafting of article: APT; critical revision of the article; MG; and final approval of the version to be published: APT, MG, PAT, MJ, SB.